OVERCLOCKING AND BENCHMARKS
This card being clocked at stock speeds means trying for an overclock is something we would strongly recommend. We won’t be changing the voltage on this card since that would require flashing a different BIOS something most of our readers wouldn’t do.
OVERCLOCKING WITH ASUS GPU TWEAK
GPU Tweak is a GPU monitor and overclocking utility that is bundled with ASUS graphics cards. While it is built to be used with ASUS GPUs, it is also compatible with virtually any Nvidia or AMD graphics card, however certain features may be unavailable. The software also provides features like profiling, monitor refresh rate overclocking, and most recently a beta for Twitch streaming was made available.
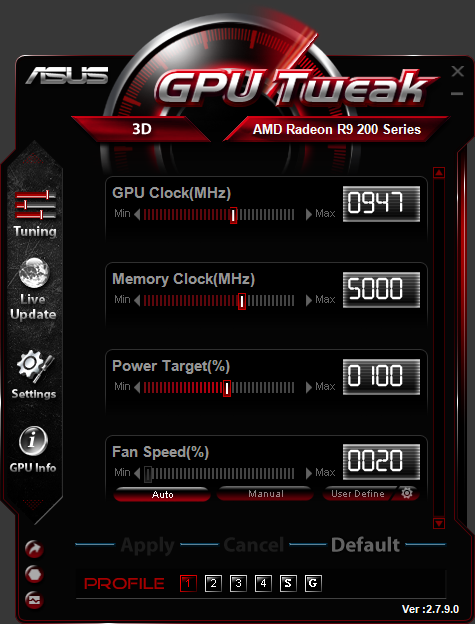 GPU Tweak makes overclocking fairly simple as it displays the entire values for each setting rather than an offset, like you’d find in other applications. We were able to get the clock speed to 1100MHz (from 947MHz) and 5548MHz (from 5000Mhz) on the memory. We feel this is something you should be able to get off of most XFX Double Dissipation R9 290’s
At Technology X, we test our graphics cards slightly different depending upon the card’s marketed purpose, whether it be for a graphics upgrade or high-end gaming. Our goal is to test in a system that has been optimized with our SSD Optimization Guide, however, CPU C State alteration may or may not have occurred depending on the motherboard and BIOS configurations. Additionally, we also try to include links to the benchmarks used in our report so that you as the reader can replicate our tests to confirm that your graphics card performs the way it should.
To test how the card performs we’ve ran a series of benchmarks including 3DMark and FurMark after that we benchmark a variety of games using FRAPS at different settings and resolutions and compare the results against other cards we’ve tested in this manner.
TEST SYSTEM CONFIGURATION
All of the components we use for testing are standard off-the-shelf PC components from major manufacturers, that can be purchased at a variety local retailers and online. We’ll also provide links to our components or similar ones that are available for those of you that find an interest in our equipment.
| PC CHASSIS: | Cooler Master HAF XM |
| MOTHERBOARD: | Gigabyte Z97 UD3H BK |
| CPU: | Intel i5 4690K |
| MEMORY: | Kingston HyperX Savage DDR3 |
| GRAPHICS CARD: | XFX R9 290 DD |
| CPU COOLER: | Phanteks PH-TC14PE |
| POWER SUPPLY: | Corsair TX 750 Watt V2 |
| STORAGE: | Samsung 830 256GB |
BENCHMARK SOFTWARE
When we test various PC hardware, we like to use benchmarks that are really available for you to download and test for yourself. In our analysis today we will be using 3DMark, and FurMark, while also measuring the performance of the card while running a variety of games. During the game we run FRAPS, which is a useful tool for measuring and logging the FPS (frames per second) a game is running at and for recording video footage of gameplay.
The games we’ll be testing are: Tomb Raider (2013), Thief (2014) Hitman Absolution, Bioshock Infinite, Crysis 3 and Middle Earth: Shadow of Mordor.
3DMARK (2013) ADVANCED FIRESTRIKE AND FIRESTRIKE EXTREME
3DMark is Futuremark’s latest in computer benchmarking. It includes tests for different performance levels, but we’re really only interested in the Fire Strike tests, which are for gaming PCs.
Fire Strike can be run at default settings or Extreme settings. We tested with both. You can also use custom settings, but the Extreme preset maxes out most options. The default settings run at a resolution of 1920×1080, with low to middling quality settings. The Extreme test runs at 2560×1440 with almost every option maxed out.
3DMark Fire Strike runs a series of 4 tests:
Graphics Test 1 – This test relies heavily on tessellation and volumetric illumination. Tessellation is breaking down polygons into simpler shapes (usually triangles), to create greater object detail. Volumetric Illumination adds lighting effects to a rendered scene allowing the viewer to see beams of light through the environment. For example, sunbeams streaming through an object like a tree or a window.
Graphics Test 2 – The second test includes complex, real-time realistic smoke simulation, which relies on particle illumination and GPU shaders to determine how visible particles of smoke or fog should be.
Physics Test – This third test involves rigid and soft body physics calculations on the CPU. These tests are not relevant for GPU comparison, so will be omitted.
Combined Test – The last test is a combines elements of previous tests, such as doing tessellation, illumination, smoke simulation, particles and post processing effects on the GPU while the CPU does 32 parallel physics simulations at the same time.
3DMARK RESULTS
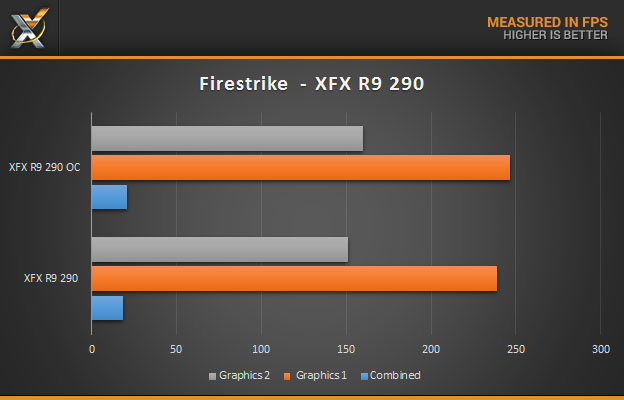
All tests were done a total of three times and the averages of each are shown below. The results are measured in FPS and then given an overall score.
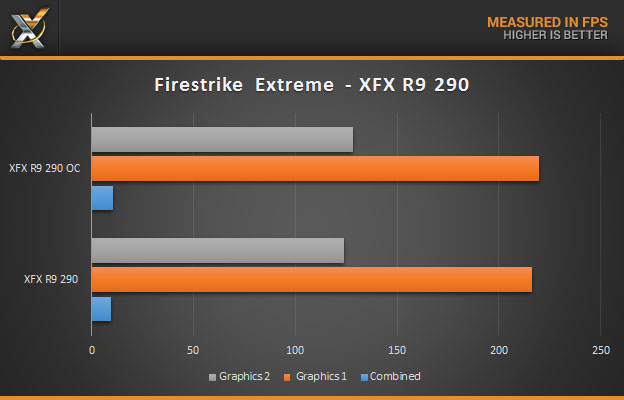 The R9 290 shows its muscle here, unfortunately the overclock barely did anything for it. Luckily this is a synthetic bench and most games show off what the overclock does.
As we see again here in Firestrike, there is barely a difference between the stock and overclocked runs.
FURMARK COOLING TEST
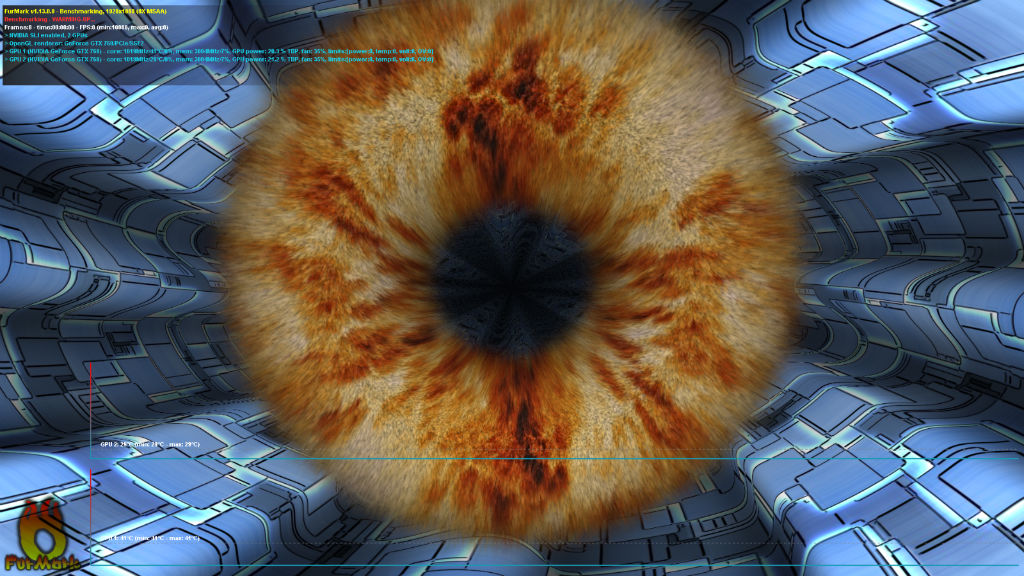
FurMark is a stress test which is used to test the cooling ability of a GPU’s cooler as well as stability of overclocks. It works by using complex, graphically intensive fur rendering algorithms which puts the GPU at a constant full load. It is literally built to overheat GPUs, which makes it the perfect benchmark for cooling.
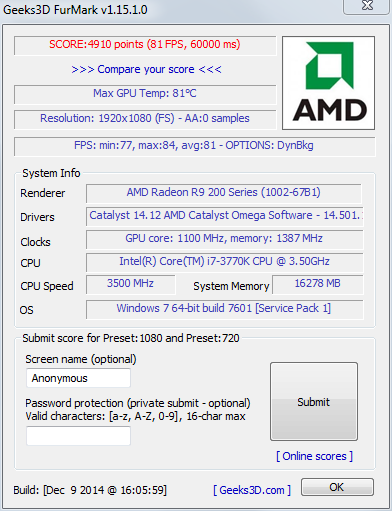
As seen to the left (click to enlarge image), after running the GPU burn-in test at the 1080p preset our GPU got to a Max of 84C and scored 4910 while overclocked.
This, in comparison to the ASUS Strix 970 we are putting it up against, is higher, but this is still a far cry from reference 290s.
While gaming we did notice the fans kicking on after 30-40 minutes, but not anything that would be a serious problem, at stock we barely noticed them. This is not a huge problem to us as the other fans in our test bench tend to pick up during gaming anyways.
All in all XFX’s Ghost thermal solution proved quite effective and did a fantastic job keeping this behemoth of a GPU cooled. Also note this is a “Worst case” scenario throughout this reviewer’s usage of the card it never went beyond 70C even after hours of gaming.
Review Overview
Design
Features
Build Quality
Price
Warranty
Great 1440P Graphics!
While the price may vary on this card, it is still one of AMD's best non reference 290s and for good reason. This card kicks serious butt and with a 2nd card, 4K gaming is very affordable possibility!
 Technology X Tomorrow's Technology Today!

Nice “mano-a-mano” review; and comes out how the 290 is overall “value leader” for entry into 1440p gaming! Many recognized this after the 970 came out… it didn’t much push healthier 1440p over 780. Two friends at time made the move buying just as the R9 290 price dropped, while they then used the approximately $100 they didn’t ante-up to 970 to offset the cost upgrading to a new 1440p panels. While the interesting thing on power… if you “sleep” your computer AMD ZeroCore can make back a good portion of the energy maxwell saves during gaming (unless you’re like >25 hours a week) in a months time.
Thanks a lot, we do see the 970 does quite well against our 290, but as I said in the article a decent 290 can be had for around $270 and does 1440P very well.