PERFORMANCE TESTING
TECHNOLOGY X TEST BENCH AND PROTOCOL
At Technology X, we test our systems slightly different depending on the purpose of the product, whether it’s for an entry-level user or if it’s for an extreme gamer. Throughout all of our testing, we ensure that our system has been optimized with our SSD Optimization Guide. Benchmarks of the products we test are that of brand new products. This means that the product has not been used previously, except possibly for some initial testing performed by the manufacturer. The purpose of this is so that we can verify that the manufacturer’s specifications match the product. Additionally, we also try to include links to the benchmarks used in our report so that you, as the reader, can replicate our tests to confirm that your system is as awesome as it should be!
SYSTEM COMPONENTS
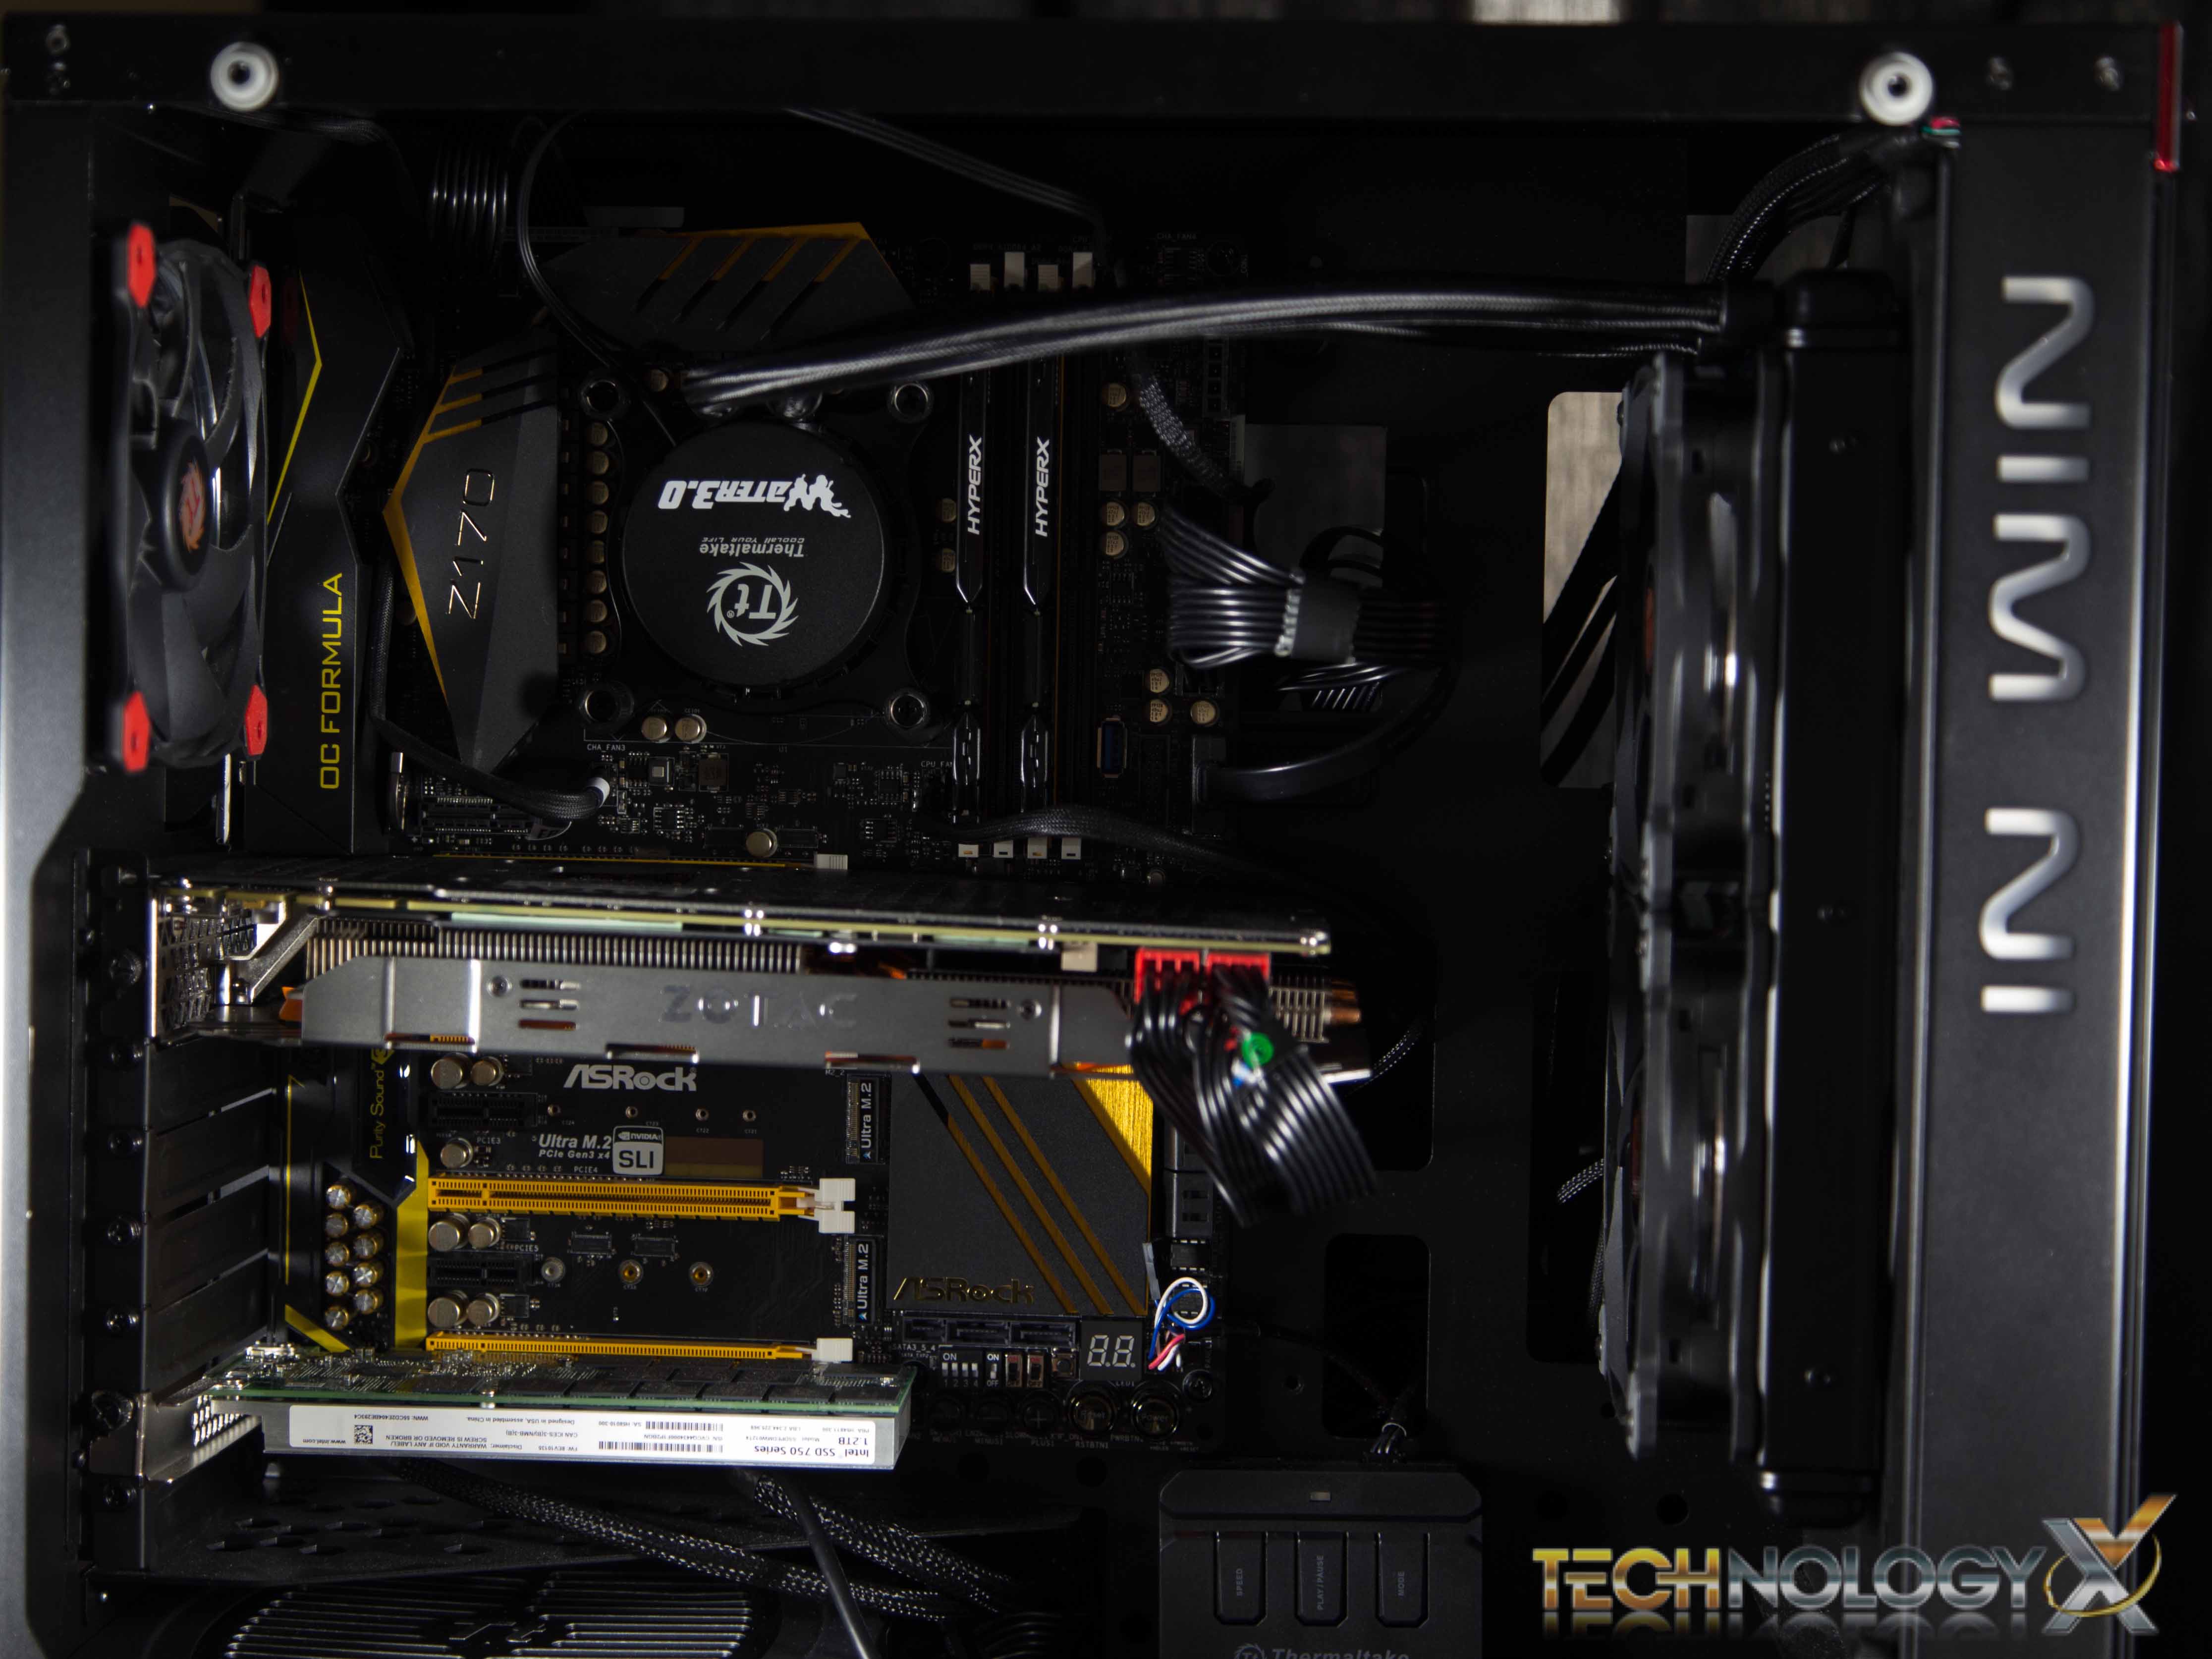
This Test Bench build was the result of some great relationships and purchases; our appreciation goes to the below mentioned manufacturers for their support in our project. All of the components we use for testing and evaluation can be easily purchased at a relatively affordable price. The links provided below can assist in pricing, as well as availability for those of you who may find interest in our equipment.
| PC Chassis: | In Win 805 Mid Tower Chassis | |
| Motherboard: | ASRock Z170 OC Formula | |
| CPU: | Intel i5-6600K | |
| CPU Cooler: | Thermaltake Water 3.0 Riing RGB 240 |
|
| Memory: | Kingston HyperX Fury 16GB DDR4-2400 | |
| Power Supply: | Thermaltake Toughpower DPS G 850W 80 Plus Platinum | |
| Graphics Card: | Zotac GeForce GTX 980 Amp! Edition 4GB | |
| System Cooling: | be quiet! Silent Wings 2 Chassis Fan | |
| Keyboard: | Tesoro Excalibur Spectrum | |
| Mouse: | i-rocks M20E Illuminated Gaming Mouse | |
| Storage: | Intel 750 Series NVMe PCIe SSD (1.2TB) |
BENCHMARK SOFTWARE
To test our Z170 system we’ll use a variety of benchmarking tools and productivity applications including CPU-Z, AIDA64 Extreme, PCMark8, Cinebench R15, Intel Extreme Tuning Utility and MaxxMem. We’ll also be using Furmark, 3D Mark and using various games to test power consumption from our graphics card.
Our performance tests will include the results, and to conclude will show the difference between idle and testing power consumption.
KINGSTON HYPERX FURY 16GB DDR4-2400 MEMORY
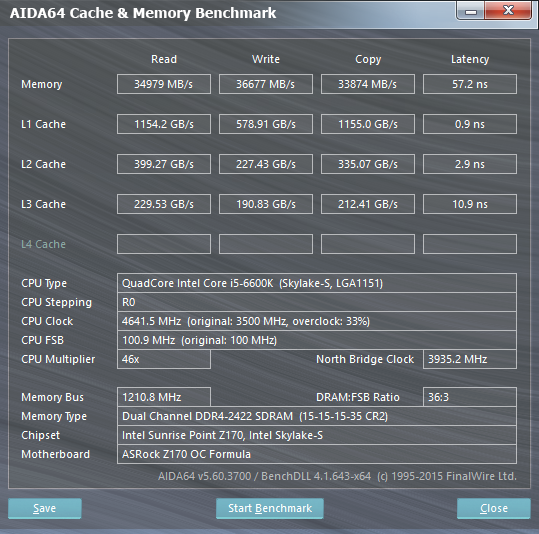
AIDA64 CACHE & MEMORY BENCHMARK
This utility is easily accessible in the AIDA64 software and tested the read, write and copy speeds of your memory, as well as the latency. It is an excellent tool for checking to see how well your memory performs when overclocked.
MAXXMEM MEMORY BENCHMARK
This is another tool used for measuring the read, write and copy speeds as well as latency of your memory. Before we even run this test, we can presume that our results shouldn’t vary too much from our AIDA64 memory benchmark.
As you can see with AIDA64 and MaxxMEM2, Kingston’s HyperX Fury has a 15-15-15-35-2T timing, and from both benchmarks, puts up some half-decent numbers for throughput and latency.
 Technology X Tomorrow's Technology Today!


