Peripherals
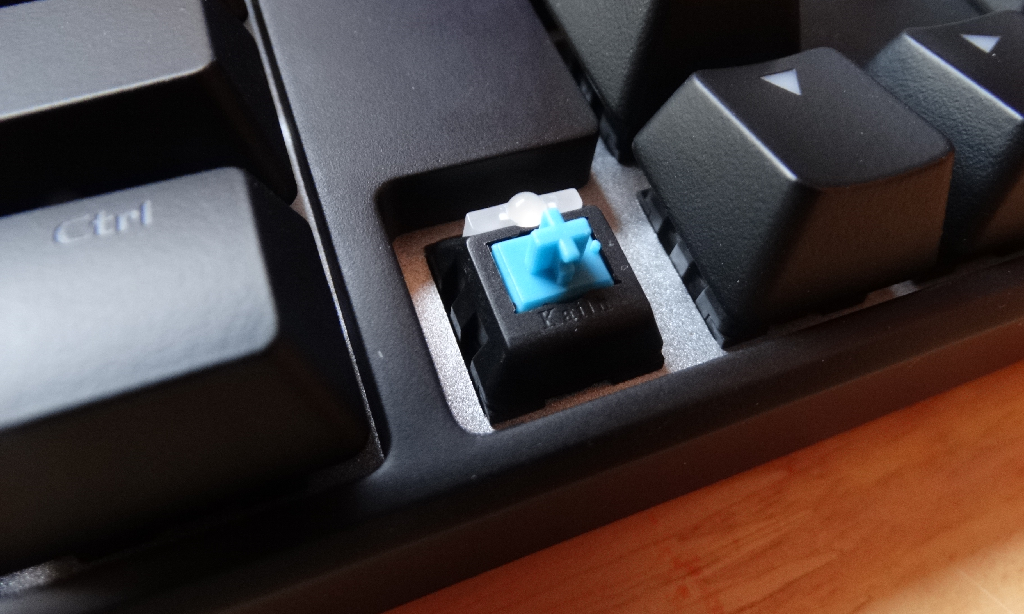
Thermaltake has also helped us round out our set up by providing us with some beautiful peripherals. The Poseidon Z, running full RGB lighting with blue switches will give us that extra great clickiness, which makes us feel like we are accomplishing more then we probably are. Check out our full review of the Poseidon Z by clicking here.
Ventus Z is again another peripheral you may find looks familiar as we have reviewed it before and are happy to see it’ll make a great addition to our Core P5 test bench. Click here for a full review
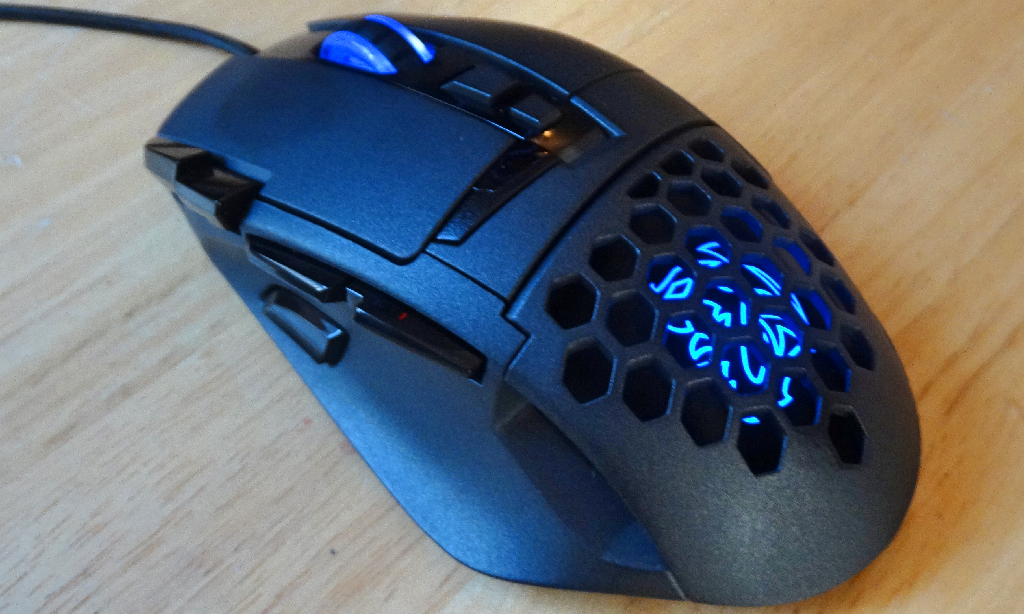 With up to 11000 DPI, you’ll have no problem gaming with it. Providing accurate snipes or long strafes the 10 programmable buttons and RGB lighting make this mouse a great addition.
Let’s move on to some benchmarking and see if our M.2 lives up to the standard on our P5 build as it set in our initial review.
Disk Benchmark – Samsung 950Pro 256Gb M.2
ATTO Disk Benchmark is perhaps one of the oldest benchmarks going and is definitely the main staple for manufacturer performance specifications. ATTO uses RAW or compressible data and, for our benchmarks, we use a set length of 256mb and test both the read and write performance of various transfer sizes ranging from 0.5 to 8192kb. Manufacturers prefer this method of testing as it deals with raw (compressible) data rather than random (includes incompressible data) which, although more realistic, results in lower performance results.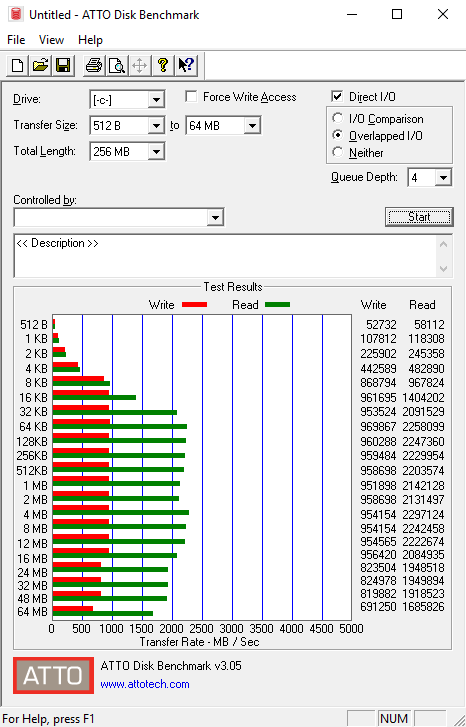 Crystal Disk Benchmark is visually straightforward, and is used for measuring the speeds at which your storage device reads and writes in both compressible (oFill/1Fill) and random, mostly incompressible, data. Random data is more consistent with everyday use of a computer, such as transferring videos, pictures and music. We run the benchmark twice, using oFill data first, and then proceeding to test with random data. Since results typically return with nearly identical scores, we only include the results for random data samples.
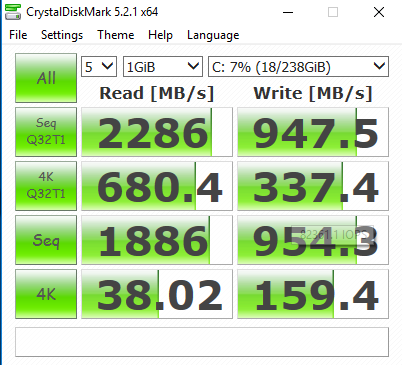 If you tuned into our full review of the Samsung 950 Pro M.2 drives you’ll notice that the scores with our new build are right on par with that. If not and you are interested in a more in depth look at the 950 Pro click here.
Last we are going to run a system stability test. This test should set a nice standard for us to work off us and compare to as we review more products this year.
For this test we will be using Aida64’s Engineer Edition. This will stress CPU, FPU, cache, memory, local disks and the GPU.
Statistics we will be focusing on today will be temperatures of the Motherboard and CPU. Idling, the motherboard is at 36C and the CPU is at 26C. One thing we know in advance is that due to how the Core P5 is built, motherboard heat will be slightly increased compared to a closed chassis which an contain some cooling, this completely open chassis will run a little warmer then room temperature or in this case 10C above. CPU running at 26 is a good standard.
We ran the system stability test for one hour at 100% load. below are the results.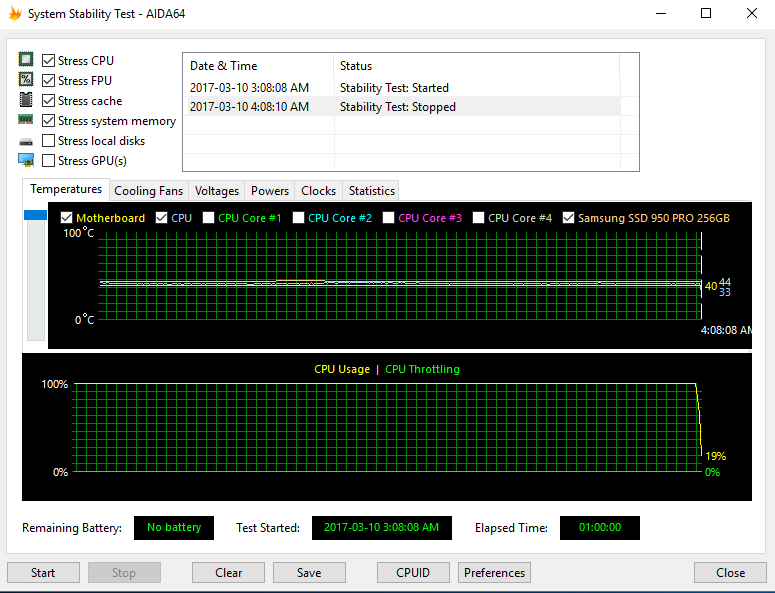 The results are good. The motherboard only increasing by 4C and the CPU increasing by 7C are great results and a standard we are happy to work with.
Another notable mention is that with the 950 Pro M.2 drive there was a temperature increase of 10C running at max load.
 Technology X Tomorrow's Technology Today!
